Diesel Fiddle Guide
Pub
Share
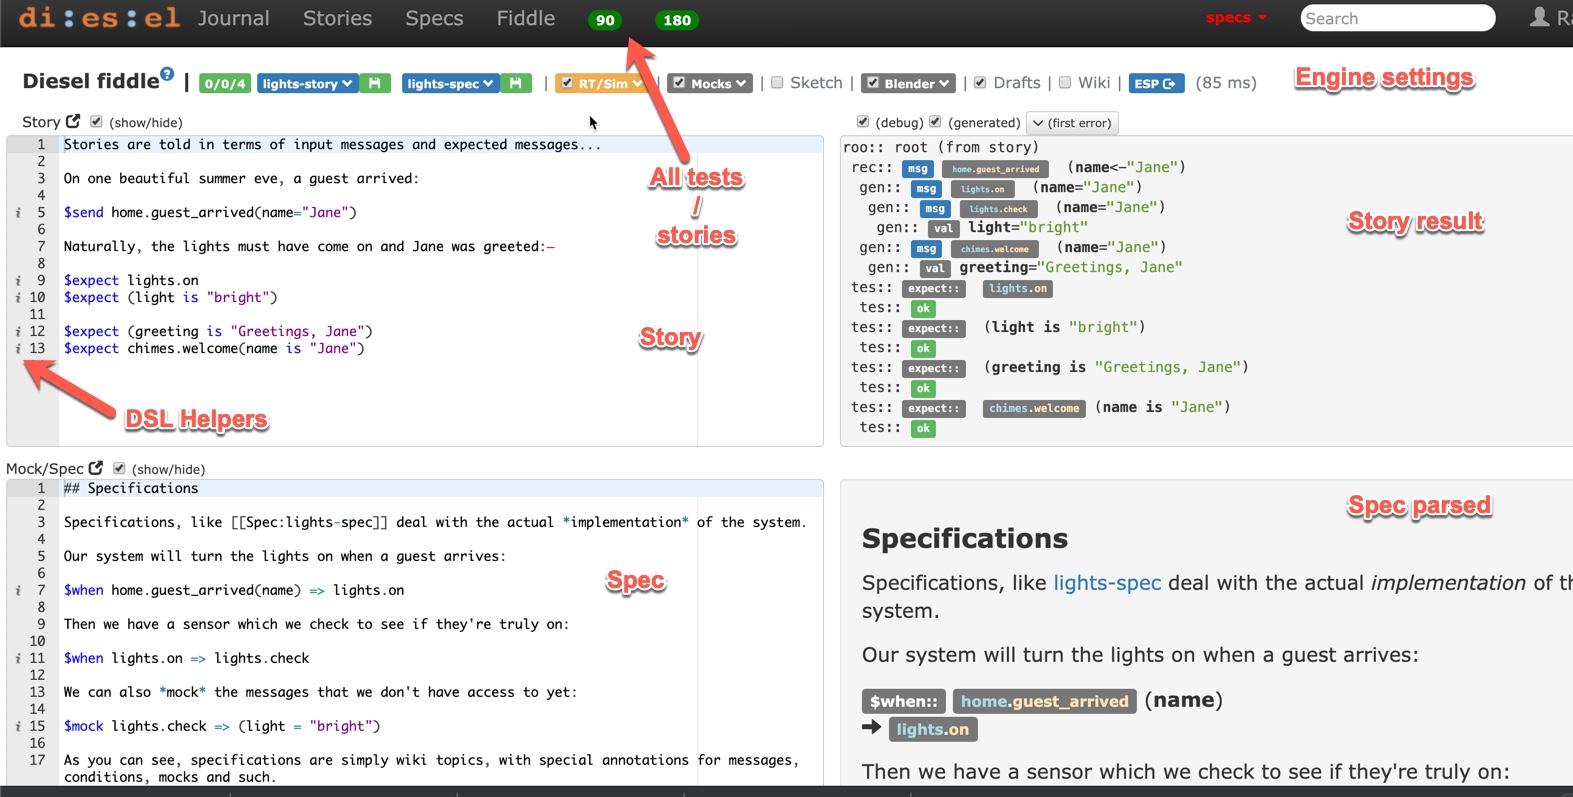
The diesel fiddle is there you quickly build out new functionality. Press the browser's Back button to go back to the fiddle - don't worry, all work in progress is continuously saved.

You basically type in the story or the spec editors and look at the results on the right side. The results are updated as you type, with a slight delay - watch for a spinner on the top-right.
The components are, in order:
- the control menu
- engine settings and other operations
- the story row
- the current story - you are working on a story at a time
- the output trace (the current story, executed in real time as you change the story)
- the spec row
- the current spec - you are working on a spec at a time
- the spec preview
- the capture row
- if you want to see a specific instance impacted by your changes, paste the json tree in the capture box and watch the trace updated in real time
- this is for advanced users...
The main idea is that there is no separate "run" or "test" phase or any such thing. The output of the current test / requirement is displayed in real-time. You can turn that off from the RT/Sim box.
The settings
The results 0/0/4 indicate how many tests were run (4) and how many failed (0).
The story dropdown allows you to select which story you're working on. The status next to it changes when you modify the story to yellow, indicating there are changes - you click this if you want to save - the saving options are:
- revert and loose your changes
- save your changes
- save as a new story - enter a name for the new story
The spec dropdown similarly allows you to select which spec you're using.
With the RT/Sim you can turn on/off the "real time" updates - if you have complex flows that alter state or take a long time, these may become bothersome. The duration of a round-trip is displayed - it goes up with the speed of the connection and the level of membership you have.
The Mocks/Sketch/Blender/Drafts are engine settings, see Flags and modes.
DSL Helpers
As you type, if a line is recognized as a DSL then the i will appear beside it and it's executed in the result frame. If there are any syntax problems, the missing i will tell you there's something wrong.
You can also change to Wiki mode from the top and see the parsed result. When a DSL construct is recognized, it looks "nice" in the page. When not, it will look like regular text.
Navigation
From the results, you can navigate to different places, like the message's definition or where it was generated from, what caused it to appear - these will be open on the left side and underlined with a yellow marker.
Also, from the story, you can navigate to the result: place the cursor on a line that is either sending a message or verifying a test and click "CMD-B" on a Mac or 'Ctrl-B' in Windows - this will scroll the results to the respective message / test result!
Select story or the spec
The two blue drop downs control the story (which runs) and the spec (rules definitions) that you're working on. The floppys next to that can be used to save your changes, drop your changes or "save as" to start a new story or spec.
ESP mode
In ESP mode, you get a new window so you can use two monitors - these windows are connected and changes in one updates the other.
You need to log in to post a comment!